On the back of soaring energy prices, fears are rising that the global economy could be heading in a stagflationary direction – one where economic growth is weak and inflation high. On average, this is the worst kind of environment for the stock market. But investors need not panic. Our analysis shows that stocks often perform well when there is stagflation, just not as well as at other times.
Why is stagflation viewed as negative for investors?
Low growth is bad for sales, as businesses and consumers tighten their belts and demand weakens. In a buoyant economy, companies can pass on higher input costs to consumers. When demand is already weak, this is not so easy. Corporate profit margins often take a hit instead, putting additional downward pressure on earnings.
As well as weakening corporate fundamentals, the ability of central banks to stimulate demand by cutting interest rates is also hampered.
Do some parts of the market perform better than others during stagflation?
Sectoral data is only available since 1974, and that reduces the number of stagflation-years we can analyze down to ten. In addition, sectors themselves have changed a lot over time. Communications services used to comprise telecom companies, such as AT&T, whereas today Alphabet (Google) and Meta combined make up nearly three quarters of the sector on a market capitalization basis (as at February 2026). Conclusions from historical analysis must therefore be interpreted carefully.
Figure 1: Sectoral performance is mixed during stagflation

US sectoral real equity returns when inflation is above and growth below its 10-year average, 1974-2025, calendar year data
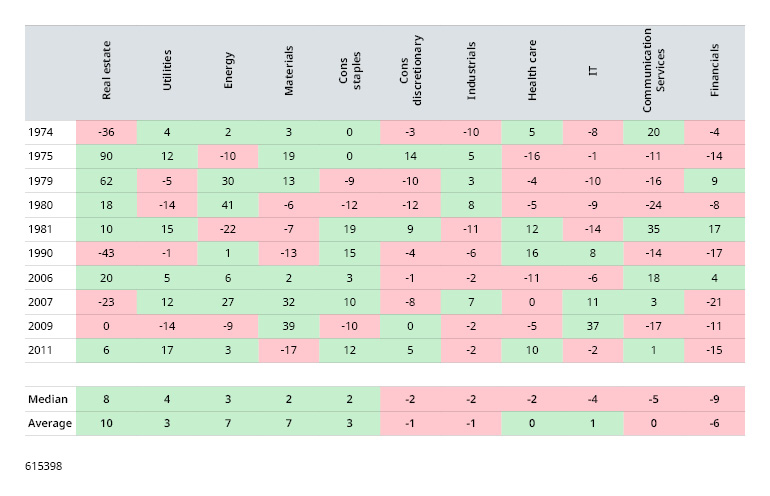
While acknowledging the caveats above, many of these divergences are intuitive:
- Defensive sectors such as utilities and consumer staples perform relatively well, as demand is less sensitive to the economic cycle.
- Energy and materials companies have typically performed well because high commodity prices have often been a cause of the high inflation during stagflation, as is the risk at present.
- Health care would also typically be classified as a defensive sector (its performance is less variable than that of the overall market, on average), so it is interesting that its performance has underwhelmed when growth has been low and inflation high over the 1974-2025 period. It is possible to analyze this sector over a longer history (back to 1927) using an alternative source – the data library produced by highly regarded academic, Kenneth French*. When we do this, the healthcare sector’s performance ties in more with intuition. It performed well in the 1940s, 50s, 60s, 70s, 80s and 90s episodes of stagflation but less well in the 2000s. This allows us to take a more positive view on the sector’s performance during stagflation than the table above would suggest.
- So-called “real assets” such as real estate can do relatively well but this sector also has one of the widest ranges of outcomes. When it comes to individual investments, performance depends on the sector of the real estate market, the length of and any inflation linkage in the rental agreement, debt maturity profile, and other factors.
- Consumer discretionary usually underperforms consumer staples, as individuals cut back on non-essentials.
- IT and communication services also both have a poor track record. This is due to a combination of demand weakness alongside rising supply costs, but also valuation impacts. IT companies, especially growth-oriented ones, tend to have high price-to-earnings (P/E) ratios because investors expect strong future earnings. The higher interest rates that usually accompany stagflation reduce the present value of future earnings, hitting growth stocks like IT companies particularly hard. This is also relevant for today’s crop of communication services companies. One potential difference for today’s big growth companies is that many are highly profitable and have global scale.
- Financials have performed poorly. Often during stagflation, yields curves invert (flip from their usual upward-sloping shape where longer dated yields are higher than shorter dated ones, to a downward-sloping one where the opposite is true). This happens as central banks keep short term rates high to manage inflation while the market prices these to fall over time. “Safe haven” buying of government bonds can also be a factor pushing longer-dated yields lower. Inverted yield curves hurt banking profitability as the short-term interest rates that banks have to pay out on deposits rise above the longer-term rates they earn as income on loans. Banks may also have to shoulder rising defaults from borrowers and weak loan demand.
While many of these are intuitive, it is important to again highlight the small sample size. When we run statistical tests (see Appendix), the only sectors where performance comes out as significantly different during stagflation-years are the materials and financial sectors.
Do any global stock markets have more, or less, favorable sector allocations?
When assessing this, it is important to complement historical analysis with qualitative judgement based on the current economic and market environment.
Figure 2: Regional market composition
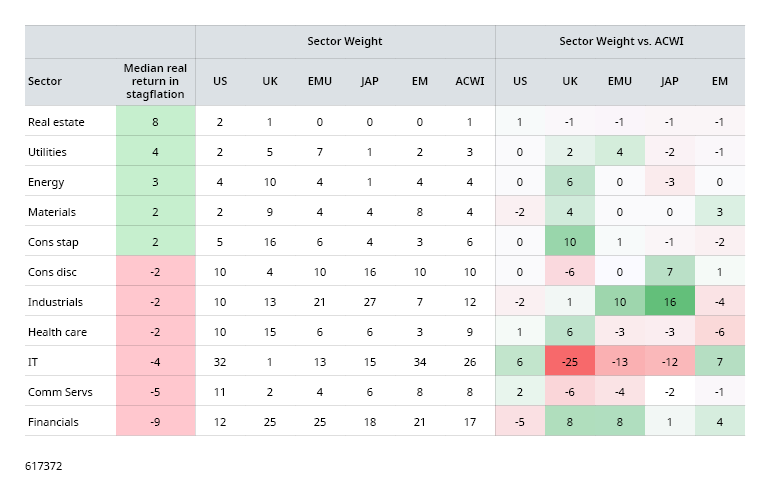
The US stands out for its large allocation to the IT sector, which has historically struggled during stagflation. Its communication services behemoths, Alphabet and Meta, are also technology companies in all but sector classification. In contrast, the US allocations to the sectors that have performed better during stagflation are all relatively low in absolute terms (totaling 15%). The US does not look like a candidate for strong performance if stagflation becomes a reality.
On the one hand, the European market would appear to suffer from its large allocation to the industrials sector. However, Germany’s plans to increase borrowing to boost defense and infrastructure spending should support many European industrials, especially given the bias towards “buying European” rather than from the US. Overweights to the utilities sector and underweights to IT and communication services could also be beneficial. In principle, the financials overweight is more problematic but, as it stands today, financials are in reasonable shape and benefitting from a steeper yield curve. This will be a sector to keep an eye on.
The UK, a market which has been unloved by global investors for many years, is also an intriguing proposition. Its 16% allocation to the defensive consumer staples sector and 10% to energy are more than double any other major market has to either. Plus, it has barely any exposure to the IT or communication services sectors compared with elsewhere. Like Europe, the UK is overweight financials. While not without risk, there is definite potential for negative perceptions about the UK market’s boring, defensive, nature to turn to its advantage. It also remains cheaply valued compared with overseas markets and therefore has a more favorable starting point.
Japan is weighed down by large allocations to global industrials, which are sensitive to international trade, and consumer discretionary. These sectors make up 44% of the MSCI Japan Index. It also does not have an overweight allocation to any of the sectors that one would anticipate could perform better. There are positive developments in corporate governance in Japan (moves to more shareholder friendly approaches) and valuations are relatively cheap, but the global backdrop is challenging.
Sector allocations are also not particularly favorable for emerging market equities, with overweights in consumer discretionary, communication services and financials.
Conclusion
Whichever market you look in, there will be winners and losers. Sector allocations can provide useful insights into potential risks but it is only by analyzing individual company fundamentals that investors can hope to identify those which have the potential to thrive and those which risk underperforming.
*“Kenneth French data” is based on 12-industry portfolios from Kenneth French’s data library.
Important information
Marketing material for financial professionals only. All investments involve risk, including loss of principal.
The views and opinions contained herein are those of Schroders and may not necessarily represent views expressed or reflected in other Schroders communications, strategies or funds. Such opinions are subject to change without notice. The material is not intended as an offer or solicitation for the purchase or sale of any financial instrument. The material is not intended to provide, and should not be relied on for, accounting, legal or tax advice, or investment recommendations.
Any reference to regions/ countries/ sectors/ stocks/ securities is for illustrative purposes only and not a recommendation to buy or sell any financial instruments or adopt a specific investment strategy. Past performance is not a guide to future performance and may not be repeated. The value of investments and the income from them may go down as well as up and investors may not get back the amount originally invested. Diversification cannot ensure profits or protect against loss of principal.
This document may contain “forward-looking” information, such as forecasts or projections. Please note that any such information is not a guarantee of any future performance and there is no assurance that any forecast or projection will be realized.
Schroder Investment Management North America Inc., 7 Bryant Park, New York NY 10018-3706. CRD Number 105820. Registered as an investment adviser with the US Securities and Exchange Commission