Mike Sobolik, Investment Strategist, Direct Real Estate, North America
Key takeaways
Competitive return potential
US private real estate has provided competitive long-term returns compared to stocks and bonds.
Durable income potential
The average income has been stronger in US private real estate than US bonds or stocks over the past 20 years.
Other potential benefits

Private real estate can be a diversifier and inflation hedge, have potential tax benefits, and provide exposure to private markets.
Institutional investors have long understood the merits of real estate, typically devoting 10% of their portfolio value to real estate.1 Individual investors only have 3% or less of their portfolios in real estate.2 They may be missing out on some of the potential benefits of including a real estate allocation within a stock and bond portfolio. Here are six.
1. Competitive long-term return potential: Total and risk-adjusted3
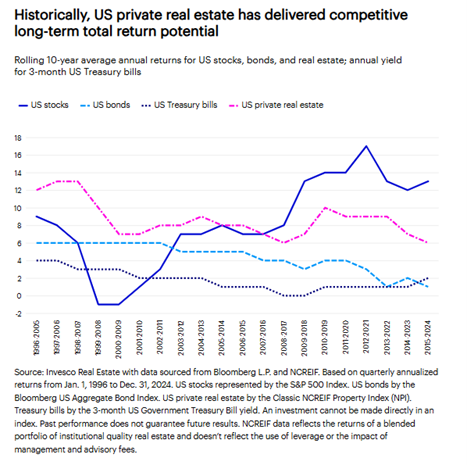
US private real estate has provided competitive total return potential compared to the return on US equities and bonds and Treasury yields over a long-term period. For the past 20 successive 10-year rolling periods of quarterly annualized returns going back to the mid-1990s, total returns for US private real estate, measured by the unlevered NCREIF Property Index (NPI), were the highest or next-highest compared to returns for US stocks, US bonds, and the average yield of the 3-month US Treasury bill. (See chart below.)
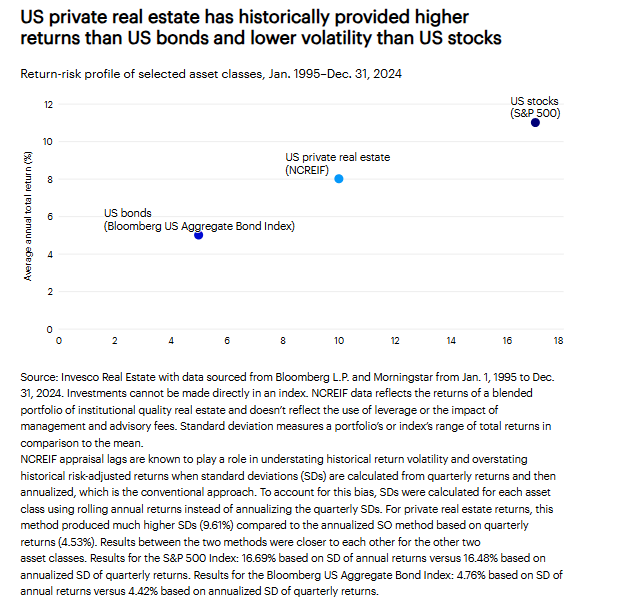
Over the past 30 years, US private real estate’s historical risk-adjusted returns have been closer to US stocks than US bonds but the volatility of its returns (i.e., the standard deviation of annual total returns over time) have been closer to US bonds than to US stocks.
2. Diversification
A key investing rule of thumb is diversification — including a variety of investments that don’t move in lockstep in a portfolio. One way to measure the diversification potential of an investment is to look at its correlation. Over the past 30 years, US private real estate has historically shown low correlation to US stocks (0.06) and US bonds (-0.11), which means it had provided greater portfolio diversification.4
3. Private markets exposure
As an alternative to US stocks ($62 trillion market capitalization at year-end 20245) and bonds ($63 trillion6), private real estate ($18 trillion7) provides meaningful exposure potential to private markets.
4. Inflation hedge
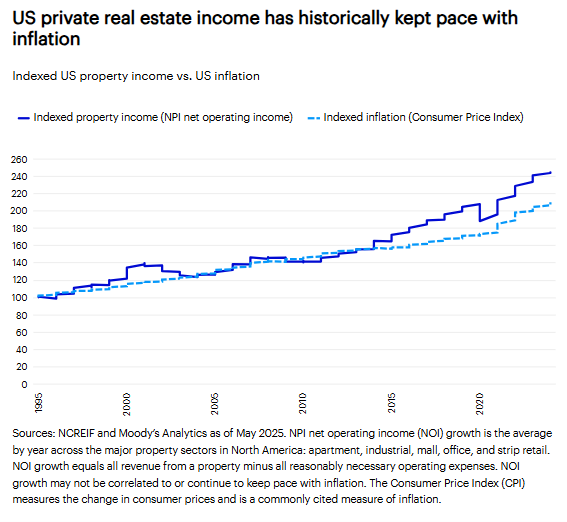
Inflation can erode the purchasing power of income from stock dividends or bonds. The income generated by private real estate is different — it’s tied to rents, which historically have increased when inflation has risen (see chart below). Real estate income growth has historically kept pace with inflation over the long term.
5. Durable income potential
Investing in private real estate may provide durable income. Over the past 20 years, average income returns have been stronger in US private real estate (5.22%) than in US bonds (4.13%) or stocks (1.94%).8
6. Tax advantages
Investing in real estate may provide tax benefits.9 For example, real estate investment trusts (REITs) can offer:
Deductions and depreciation
Investors may benefit from a REITS’ ability to deduct certain expenses, such as mortgage interest, property repairs, and depreciation.
Capital gains taxes instead of income taxes
REITs may realize any profits from a property sale as a capital gain, and the tax rates are typically lower than ordinary income tax rates.10
Earnings and dividends
REITs aren’t subject to corporate income tax on earnings distributed to investors, and dividends are taxed at an investor’s individual tax rates.11 Tax reporting is also more straightforward on a 1099-DIV (no K-1s).
Real estate can be owned through other structures besides REITs, so before investing in real estate consult a tax professional about ownership options.
Consider private real estate
The track record of US private real estate offers compelling reasons to consider an allocation to it in a portfolio with only US stocks and bonds. Of course, real estate investing, as with all investing, isn’t risk-free and past performance isn’t a guarantee of future results.
Footnotes
1Source: 2024 Institutional Real Estate Allocations Monitor, Hodes Weill and Associates, Cornell University (Cornell Baker Program in Real Estate). There may be material differences in the investment goals, liquidity needs, and investment horizons of individual and institutional investors. Investors should consult with a financial professional regarding their own situation and risk tolerance before making any investment decisions.
2Source: Bain & Company, “Global Private Equity Report 2023.” Ultra-high-net-worth individuals and family offices ($30 million+ net worth) are estimated to have alternatives allocations of nearly 20%; all other categories of individual investors are estimated to have alternatives allocations ranging from 0% to 3%. Real estate is the largest investment class within the alternatives category.
3Risk-adjusted return is calculated by dividing the total return by the standard deviation of return during the specified.
4Source: Invesco Real Estate using real estate data from NCREIF (NPI) and Bloomberg L.P. (S&P 500 Index for US stocks; Bloomberg US Aggregate Bond Index for US bonds). Correlations were calculated over the period from Jan. 1, 1995 to Dec. 31, 2024. Investments cannot be made directly in an index. NCREIF data for the NPI Index reflects the returns of a blended portfolio of institutional quality real estate and does not reflect the use of leverage or the impact of management and advisory fees. Past performance does not guarantee future results. Diversification does not guarantee a profit or eliminate the risk of loss.
5Source: Siblis Research as of Dec. 31, 2024.
6Source: Invesco Real Estate, utilizing data from SIFMA Research. As of Dec. 31, 2024, US fixed income outstanding totaled $46.9 trillion, excluding mortgage-backed securities (MBS) and asset-backed securities (ABS). The overall estimate inclusive of MBS and ABS of $63 trillion is based on growing the overall 2021 total by the same growth rate experienced in 2022, 2023, and 2024 for the total ex-MBS and ex-ABS.
7Source: Invesco Real Estate analysis as of Dec. 31, 2024, using latest available data from CoStar, YardiMatrix, National Association of Realtors, US Census Bureau, and Real Capital Analytics.
8Sources: Invesco Real Estate using real estate income return data from NCREIF (NPI); yield-to-worst bond return data from Bloomberg L.P. (Bloomberg US Aggregate Bond Index for US bonds); and the difference between total return and price equity return data from Moody’s Analytics (S&P 500 Index for US stocks). Returns were calculated from Jan. 1, 2005 to Dec. 31, 2024. Investments cannot be made directly in an index. Correlation is the degree to which two investments have historically moved in relation to each other. Diversification does not guarantee a profit or eliminate the risk of loss.
9The information on tax advantages does not constitute tax advice. Because each investor’s tax position is different, the benefits listed above may not be realized. A change in US tax laws, including current proposed legislation, could also impact on the benefits of investing in real estate. Investors should always consult with a tax professional before making any investment decisions.
10Ordinary income tax brackets in the US range from 10% to 37%. Short-term capital gains, which are properties held one year or less, can range from 10% to 37%, depending on ordinary income tax bracket. Long-term capital gains, which are properties held a year and one day or more, are taxed more favorably, ranging from 0% to 20%, depending on income tax bracket.
11The taxable portion of REIT distributions is reduced to the extent there is return on capital resulting from depreciation and amortization. The Tax Cuts and Jobs Act of 2017 is not applicable to capital gain dividends or certain qualified dividend income. It is only available for qualified REITs. The tax benefit is set to expire after Dec. 31, 2025 but may be impacted by currently proposed legislation.
Important information
Where individuals or the business have expressed opinions, they are based on current market conditions, they may differ from those of other investment professionals and are subject to change without notice.
US private real estate is represented by the NCREIF Property Index on the basis that the NPI is the broadest measure of private real estate index returns. The NPI is published by the National Council of Real Estate Investment Fiduciaries and is a quarterly, composite total return (based on appraisal values) for private commercial real estate properties held for investment purposes including fund expenses but excluding leverage and management and advisory fees. All properties in the NPI have been acquired, at least in part, on behalf of tax-exempt institutional investors and held in a fiduciary environment. NCREIF data reflects the returns of a blended portfolio of institutional quality real estate and does not reflect the use of leverage or the impact of management and advisory fees.
US equities are represented by the S&P 500 Index, an unmanaged index of the 500 largest stocks, weighted by market capitalization and considered representative of the broader stock market. The S&P 500 Index is subject to market risk.
US bonds are represented by the Bloomberg US Aggregate Bond Index, an index of securities that covers the US investment grade fixed rate bond market, with index components for government and corporate securities, mortgage pass-through securities and asset-backed securities; and is subject to credit risk.
US Treasury or T-bills are represented by the Bloomberg 90 Day U.S. Treasury Bill Index, an unmanaged index designed to measure the performance of public obligations of the U.S. Treasury that have a remaining maturity of greater than or equal to 1 month and less than 3 months.
The S&P 500 Index, the Bloomberg US Aggregate Bond Index and the Bloomberg 90 Day U.S. Treasury Bill Index are meant to illustrate general market performance; it is not possible to invest directly in an index.
The indexes noted above represent investments with material differences from an investment in private real estate, including related vehicle structure, investment objectives and restrictions, risks, fluctuation of principal, safety, guarantees or insurance, fees and expenses, liquidity, and tax treatment. An investment in private real estate may not be a direct investment in real estate and has material differences from a direct investment in real estate, including those related to fees and expenses, liquidity, and tax treatment.
Investment risks
The value of investments and any income will fluctuate (this may partly be the result of exchange rate fluctuations) and investors may not get back the full amount invested. Property and land can be difficult to sell, so investors may not be able to sell such investments when they want to. The value of property is generally a matter of an independent valuer's opinion and may not be realized.
Fixed-income investments are subject to credit risk of the issuer and the effects of changing interest rates. Interest rate risk refers to the risk that bond prices generally fall as interest rates rise and vice versa. An issuer may be unable to meet interest and/or principal payments, thereby causing its instruments to decrease in value and lowering the issuer's credit rating.
Treasury securities are backed by the full faith and credit of the US government as to the timely payment of principal and interest.
Generally, real estate assets are illiquid in nature. Although certain kinds of investments are expected to generate current income, the return of capital and the realization of gains, if any, from an investment will often occur upon the partial or complete disposition of such investment.
Investing in real estate typically involves a moderate to high degree of risk. The possibility of partial or total loss of capital will exist.
Not a Deposit | Not FDIC Insured | Not Guaranteed by the Bank | May Lose Value | Not Insured by any Federal Government Agency
This information is intended for US residents.
Invesco Distributors, Inc. is the US distributor for Invesco's Retail Products, Collective Trust Funds and CollegeBound 529. Invesco Capital Management LLC is the investment adviser for Invesco’s ETFs. Invesco Unit Investment Trusts are distributed by the sponsor, Invesco Capital Markets, Inc. and broker dealers including Invesco Distributors, Inc. All entities are indirect, wholly owned subsidiaries of Invesco Ltd.
Institutional Separate Accounts and Separately Managed Accounts are offered by affiliated investment advisers, which provide investment advisory services and do not sell securities. These firms, like Invesco Distributors, Inc., are indirect, wholly owned subsidiaries of Invesco Ltd.
The information on this site does not constitute a recommendation of any investment strategy or product for a particular investor. Investors should consult a financial professional/financial consultant before making any investment decisions.
ETF Shares are not individually redeemable and owners of the Shares may acquire those Shares from the Fund and tender those Shares for redemption to the Fund in Creation Unit aggregations only, typically consisting of 10,000, 20,000, 25,000, 50,000, 80,000, 100,000 or 150,000 Shares.
©2025 Invesco Ltd. All rights reserved