Key takeaways
- With average corporate defined benefit (DB) funded status levels above 100% for a second consecutive year, the challenge for plan sponsors has shifted from closing a deficit to protecting funded status gains.
- Geopolitical uncertainty is casting a shadow over a complex economic landscape—one shaped by the rapid rise of artificial intelligence (AI), elevated equity valuations, and a shifting Federal Reserve policy backdrop.
- A concentration of risks across equities, yield curves, and credit, may carry higher stakes late in the glidepath and may be a reason to consider more thoughtful allocations.
- Evolving options for using pension surpluses are influencing investment decisions, resulting in a greater incentive to increase surplus levels—not just maintaining them.
The average U.S. corporate DB plan ended 2025 overfunded at 108%1
This milestone, which hadn’t been reached for almost two decades prior to 2024, has fundamentally changed the priorities of plan sponsors and the questions they need to ask.
When funded status improves, the traditional playbook calls for reducing equities and increasing fixed income hedging. However, today’s market dynamics complicate those moves. Things like persistent inflation risks, evolving rate uncertainty, concentrated equity gains, and historically tight credit spreads carry consequences for funded-status volatility, contribution risk, and long-term policy decisions.
Let’s explore the four capital market dynamics we believe merit the focus of DB plan sponsors, and why they matter from a pension governance and risk-management perspective.
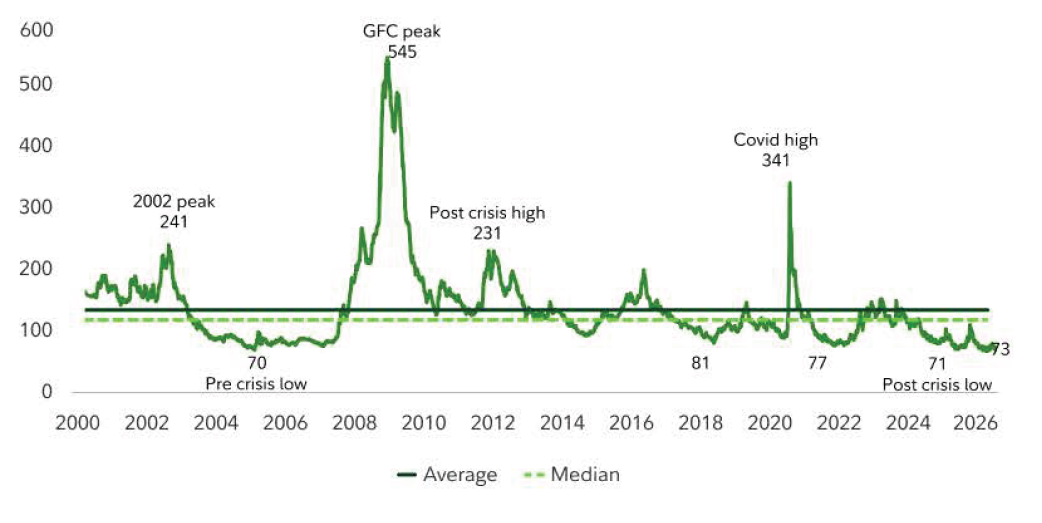
Credit spreads have remained rather tame
- Despite heightened volatility and geopolitical uncertainty, credit spreads are relatively contained, especially compared to equities, and have tightened to near historic lows.
- Spread risk feels asymmetric at the moment, as they have reached a lower bound level that limits further compression based on historical standards. Yet when a crisis hits, the widening spread is severe and, at times, north of 200 basis points2 (see Exhibit 1).
- Liability valuations are driven by changes in high-quality bond yields. When yields fall, liabilities rise and vice versa. A large component of a corporate bond yield is its spread over Treasuries. If spreads tighten, liability increases (everything else equal).
- The bottom line: Tight spreads create unique dynamics for hedging pension liabilities, with risks more skewed to spread widening events, which actually reduces liability values temporarily. So, do plans consider reducing the credit component of the liability hedge while maintaining the tight interest rate hedge? Can they nimbly increase it if spreads widen? These are all important considerations for sponsors and their investment partners to discuss.
Exhibit 1: Credit spreads act as a gauge of financial stress and investor risk appetite

Fed expectations continue to shift
- Over the last six to nine months, we’ve gone from “how many rate cuts in 2026?” to now a hold for the foreseeable future, begging the question of if we are moving to a neutral posture or a rate hike. Markets are starting to price in rate hikes as of mid-May after strong inflation readings in addition to other strong data, such as an improving manufacturing sector and stabilizing labor markets.
- Inflation remains elevated and sticky and above the Fed’s preferred 2% level with greater risks to the upside driven by lingering effects on oil supply and pricing post any conflict resolution, which only exacerbates the existing dynamics that were already keeping inflation above the Fed’s target. But the reality is, can the Fed continue looking through oil after looking through tariffs?
- Following the April rate decision, Jerome Powell described the U.S. labor market as being in “an unusual and uncomfortable kind of balance”3 with AI and war-related consequences to be determined, creating “two-sided” risks, with inflation risk at the forefront.
- What this means: This keeps interest rate uncertainty at high levels, making the requirement for interest rate hedging a critical focus. Changes in interest rates have a dramatic impact on liability valuations, especially given long-dated liabilities that magnify volatility even further. Sponsors should remain focused on hedging this risk with a tight hedge ratio, particularly with large, fixed income allocations that ease implementation. Forecasting interest rates has historically been difficult, and sponsors may want to avoid taking this uncompensated risk within their pension portfolios.
A closer look at the yield curve
- A steepening bias driven by higher-than expected inflation risk, the government potentially impacting Fed decision-making, and increased expected Treasury supply (driven by increasing budget deficits) puts upward pressure on term premia.
- The impact: Be careful of overweighting 30-year rate risk relative to liabilities (capital efficient duration) if the curve steepens—you may lose out. Plans with less fixed income often outweigh 30-year bonds to amplify their duration sensitivity (hedge ratio) in a capital efficient manner relative to their 8- to 12-year duration liabilities.
Reinforcing the importance of equities for diversification
- While equity allocations have been declining among pension plans (driven by higher pension-funded levels), the need for equities remains in many instances, albeit in smaller doses. This is supported by liability nuances and the need to maintain, or increase, funded status cushions.
- Compelling non-U.S. equity and currency valuations, and a potential rotation away from U.S. large cap leadership paints a landscape for continued non-U.S. outperformance versus U.S. equities, which have outperformed the U.S. since the start of 2025.
- Factors such as a strong dollar during geopolitical uncertainty, greater economic fallout abroad from conflicts, and shifting U.S. equity valuations may slow this process.
- Why it matters: A continued diversified approach to global equity exposure is warranted and reinforces the benefits of long-term diversification amid the ongoing market developments and challenges.
Learn more about Fidelity Institutional Pension Solutions.
Please visit Fidelity’s Communities on Alternative Investments.
Daniel Tremblay, CFA, is the head of Pension Solutions within Fidelity Institutional®. In this role, he engages with internal institutional distribution and consulting partners to shape our strategy, drive the business, and focus on the innovation, development, and delivery of pension solutions and strategies.
1. Milliman, Inc.: Milliman 100 Pension Funding Index analyzes the 100 largest U.S. corporate pension plans, as of Dec. 31, 2025. “Pension Funding Index January 2026,” by Zorast Wadia, Jan. 7, 2026. https://www.milliman.com/en/insight/pension-funding-index-january-2026.
2. Source: Bloomberg Finance L.P., April 30, 2026. Bloomberg Credit Index Option-Adjusted Spread (OAS) measures the yield difference between a portfolio of non-Treasury bonds and the risk-free Treasury curve.
3. Jerome Powell’s final press conference as Federal Reserve Chair on April 29, 2026. (Source: https://www.federalreserve.gov/mediacenter/files/FOMCpresconf20260429.pdf)
Unless otherwise expressly disclosed to you in writing, the information provided in this material is for educational purposes only. Any viewpoints expressed by Fidelity are not intended to be used as a primary basis for your investment decisions and are based on facts and circumstances at the point in time they are made and are not particular to you. Accordingly, nothing in this material constitutes impartial investment advice or advice in a fiduciary capacity, as defined or under the Employee Retirement Income Security Act of 1974 or the Internal Revenue Code of 1986, both as amended. Fidelity and its representatives may have a conflict of interest in the products or services mentioned in this material because they have a financial interest in the products or services and may receive compensation, directly or indirectly, in connection with the management, distribution, and/or servicing of these products or services, including Fidelity funds, certain third-party funds and products, and certain investment services. Before making any investment decisions, you should take into account all of the particular facts and circumstances of your or your client’s individual situation and reach out to an investment professional, if applicable.
Fidelity Investments is an independent company, unaffiliated with Institutional Investor LLC. There is no form of legal partnership, agency affiliation, or similar relationship between your financial advisor and Fidelity Investments, nor is such a relationship created or implied by the information herein. Fidelity Investments is a registered service mark of FMR LLC.
Fidelity Investments® provides investment products through Fidelity Distributors Company LLC; clearing, custody, or other brokerage services through National Financial Services LLC or Fidelity Brokerage Services LLC, Members NYSE, SIPC.
Institutional asset management is provided by FIAM LLC and Fidelity Institutional Asset Management Trust Company.
1264544.2.0